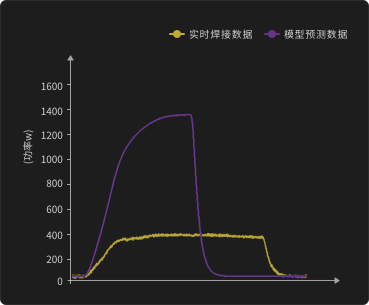
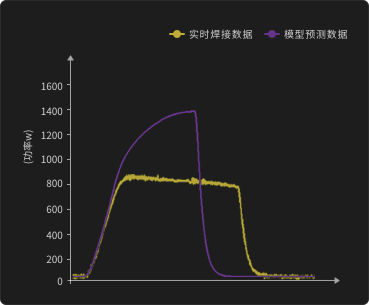
No weld / missed weld
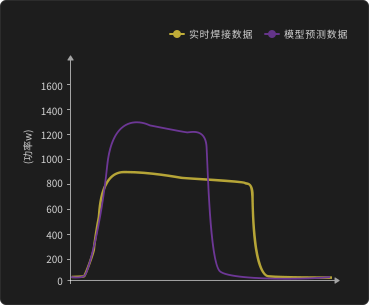
Weld defect · measured curve vs. model prediction
Online, AI-driven inspection of every ultrasonic metal weld. A pass/fail verdict and the likely cause of each defect in under 0.5 seconds, with miss and false-alarm rates that meet production-line requirements.
The inspection system collects process data in real time during welding — power, height, pressure and frequency. Each weld generates thousands to tens of thousands of high-frequency data points.
Multiple AI models are trained and evaluated on this data, and the best-performing model for your specific production environment is selected. The inputs and outputs of every model, along with every model version, are kept in a model repository for future optimization and full product-quality traceability.
Once deployed, the production system streams each part’s welding data to the model. The model decides pass or fail; for failed parts it also identifies the likely cause, and the PLC diverts the part.
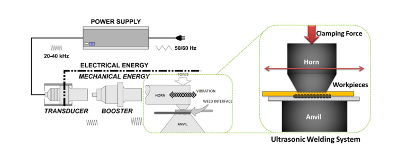
Power, height, pressure and frequency are captured for every weld in real time from the welder and PLC.
Several models are trained and compared; the best one for your environment is deployed, and all versions are kept for traceability.
A verdict and defect cause in <0.5 s. A part passes when its predicted score exceeds the threshold; NG parts are diverted by the PLC.
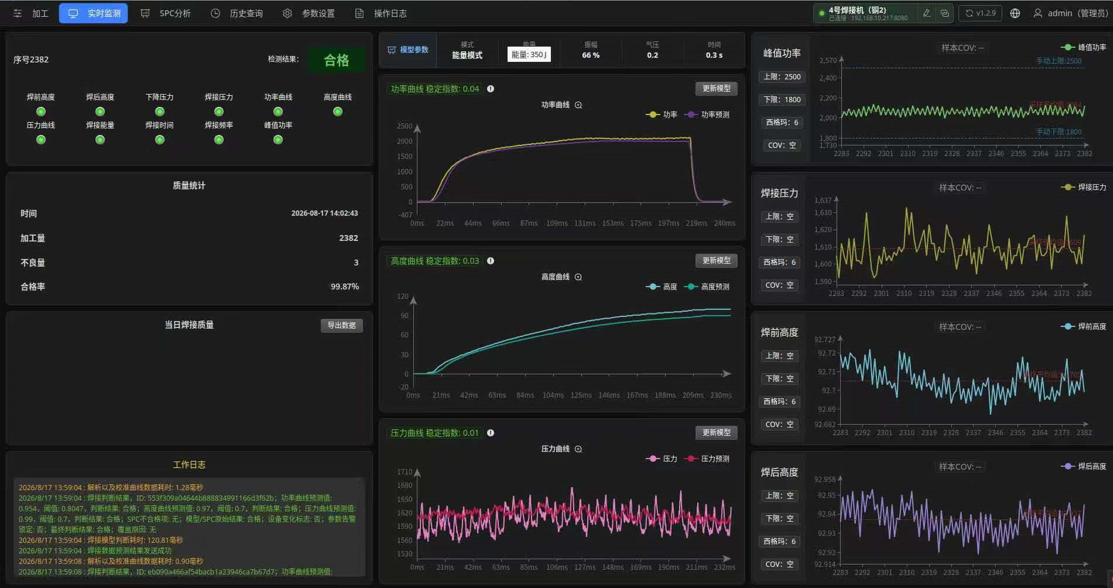
Live process curves for each weld alongside the model’s prediction, per-parameter verdicts, yield statistics and a running work log.
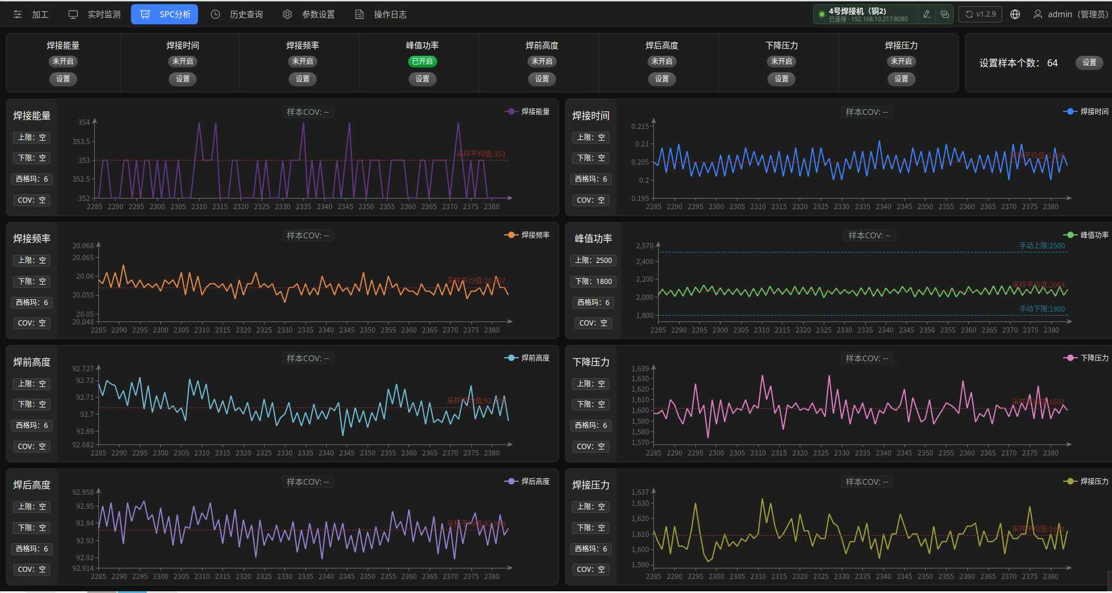
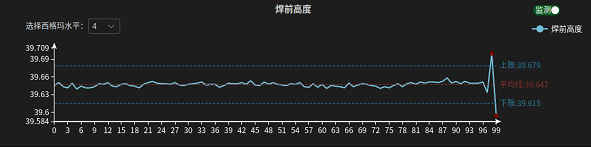
Statistical process control charts for peak power, pressure, and pre-/post-weld height, with limits and capability metrics.
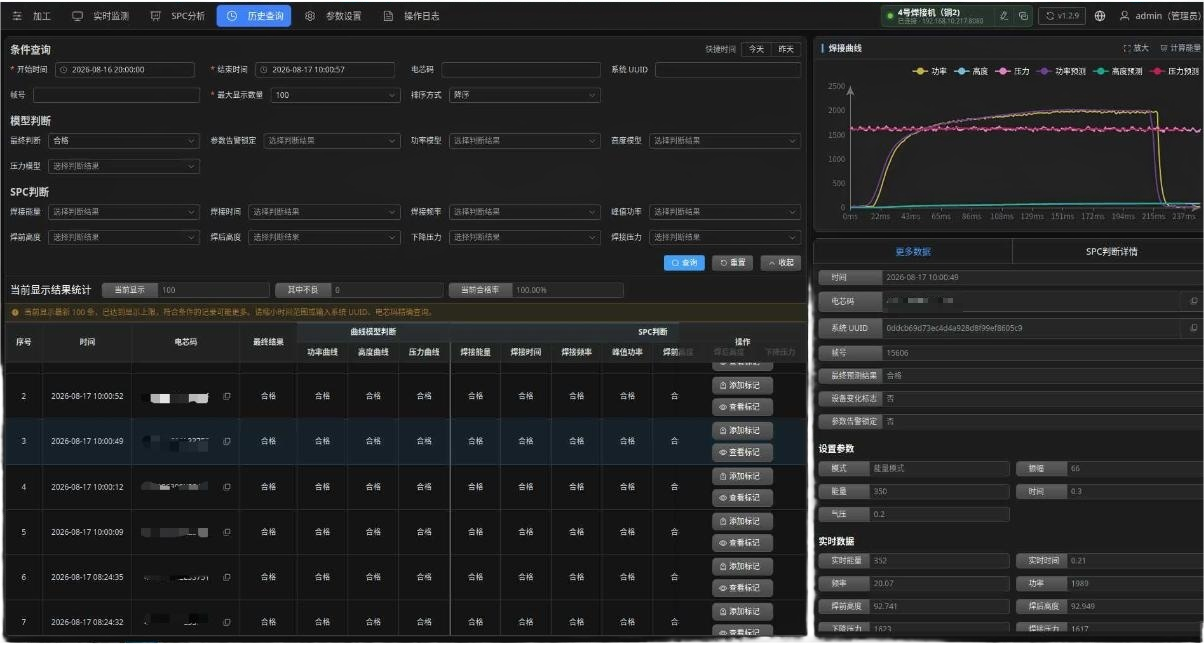
Query historical data by time or barcode to trace any part back to its exact welding record.
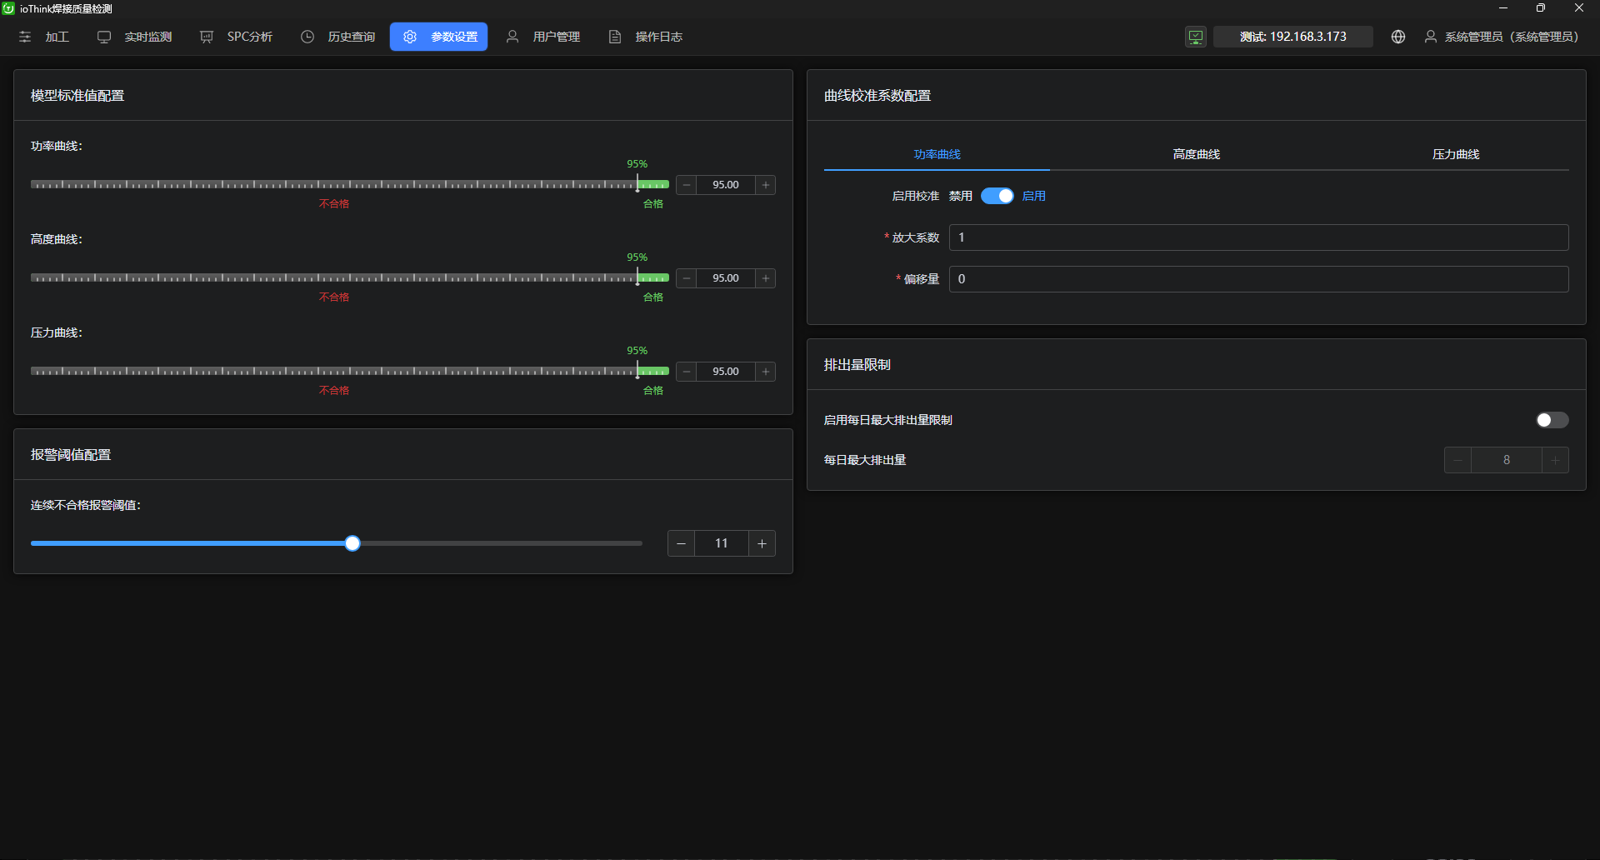
Parameter thresholds can be adjusted flexibly to suit actual production conditions.
No weld, weak weld, missed weld and more.
Oil contamination, adhesive tape, severe tab folding, extra or missing layers.
Horn/anvil wear, loose screws, transducer damage.
Continuous monitoring of the welder’s operating stability.
Real power curves from production. The model compares each weld’s measured curve with its predicted good-weld curve; a part passes when its predicted score is above the threshold.
Weld defect · measured curve vs. model prediction
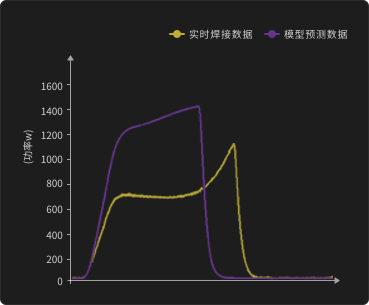
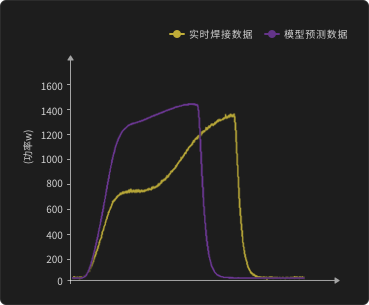
Weld defect · example A
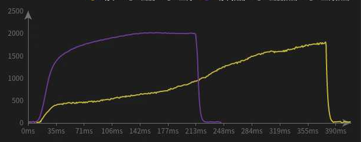
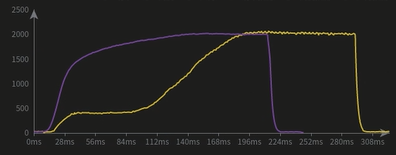
Weld defect · example B
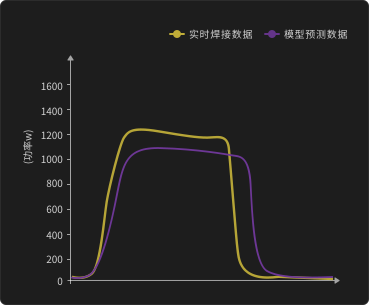
Material issue
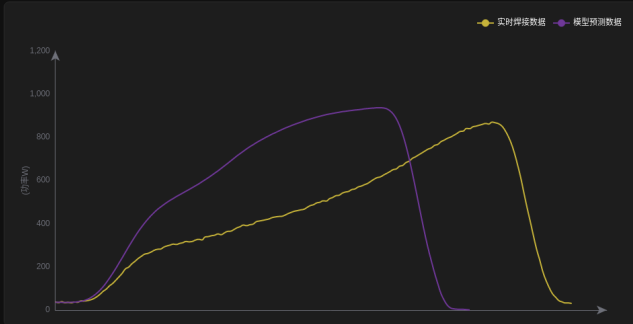
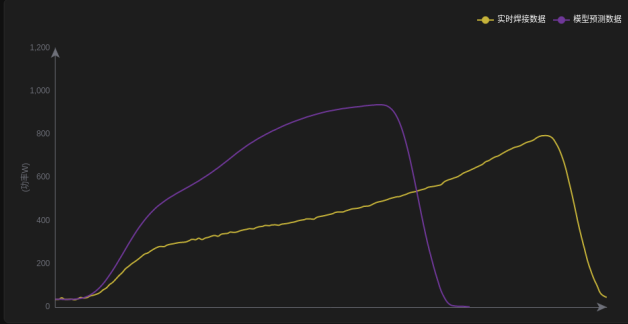
Material issue · oil contamination
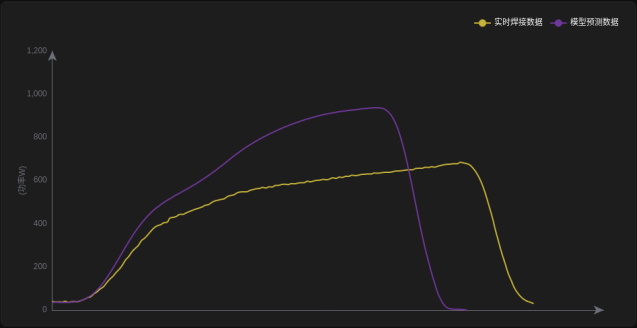
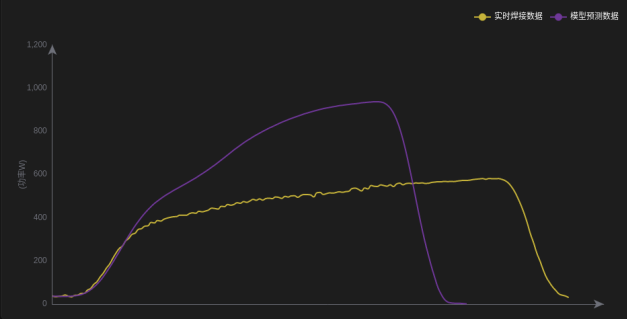
Material issue · foreign material
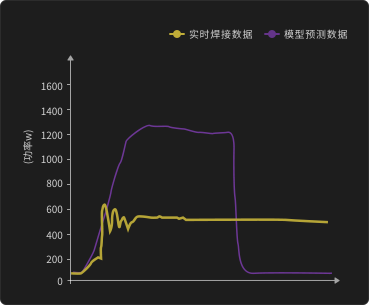
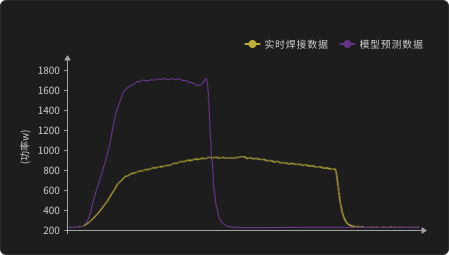
Equipment alarms · left: anvil sticking, right: transducer damage
When process curves look alike, pre- and post-weld height SPC data can still reveal this issue. Below: typical height fluctuations caused by extra or missing layers.
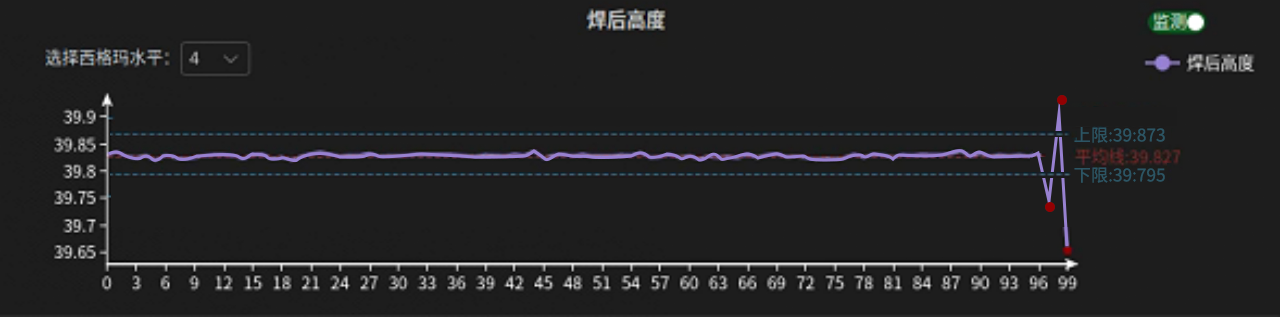
Validated by the technical departments of CATL and Wanxiang A123 in late 2022, and since 2024 deployed for SVOLT, REPT BATTERO, Sunwoda and others on EV and energy-storage battery lines at multiple sites in China and abroad — with two years of fault-free mass production.
Custom development, technology licensing or OEM products — talk to us about the partnership model that fits your equipment.